
Net gas flow data Austria
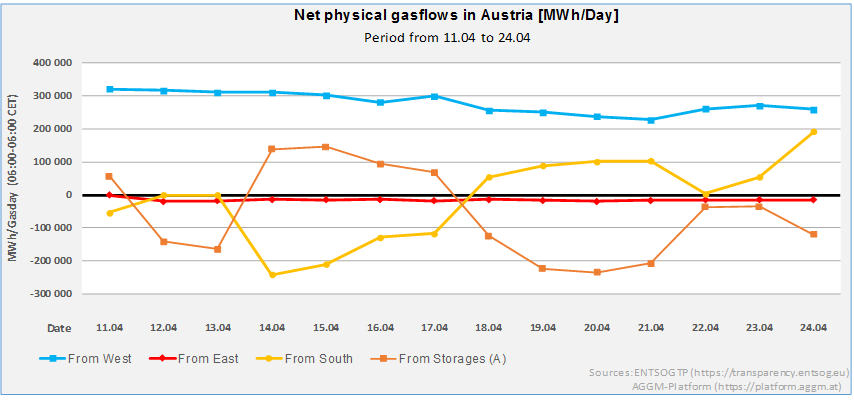
Here you can find a two-week review of the development of the physical net gas flow data at the Austrian cross-border interconnection points in the unit MWh/day. The data originates from the ENTSOG Transparency Platform to which the European transmission system operators report their data on a daily basis. The visible data status is generally that of the previous day.
The red line in the graph shows imports to Austria from Slovakia, the blue line shows imports from Germany and the yellow line shows imports from Italy. The orange line shows the withdrawal from storage facilities for Austria. Lines below the zero line indicate exports or, in the case of storage facilities, injection.
Further sources of up-to-date information:
- On the website of the market area manager AGGM you can find the hourly updated market area data of the Austrian entry/exit points at https://platform.aggm.at/portal/visualisation/map.
- AGGM also publishes a daily status report: https://www.aggm.at/fileadmin//AGGM/Lagebericht/aggm-lagebericht.pdf.
- Updated information on domestic gas supply can also be found at e-control: https://www.e-control.at/ukraine-krieg-energieversorgung-in-oesterreich.
DISCLAIMER
The graphic visualises the Austrian border interconnection points (entry/exit) in the west, east and south. The respective interconnection points (IP) are read out, see graphic. The data visualised by GCA in this diagram comes from a publicly accessible source, whereby the data entered is provided free of charge for public use.
The data that GCA visualises here come from publicly accessible sources, whereby the data entered on the platforms in question are made available for public use free of charge.
- The Transparency Platform of ENTSOG https://transparency.entsog.eu/#/map
GCA accesses these data and visualises them with the best of intentions. The gas day shown in each case starts at 6:00 a.m. (CET).
GCA does not make any assurances regarding the correctness or completeness of the visualised information. Any decisions and actions taken by the user on the basis of this information are the sole responsibility of the user. GCA assumes no liability in this regard.