
Daily CEE FlowChart
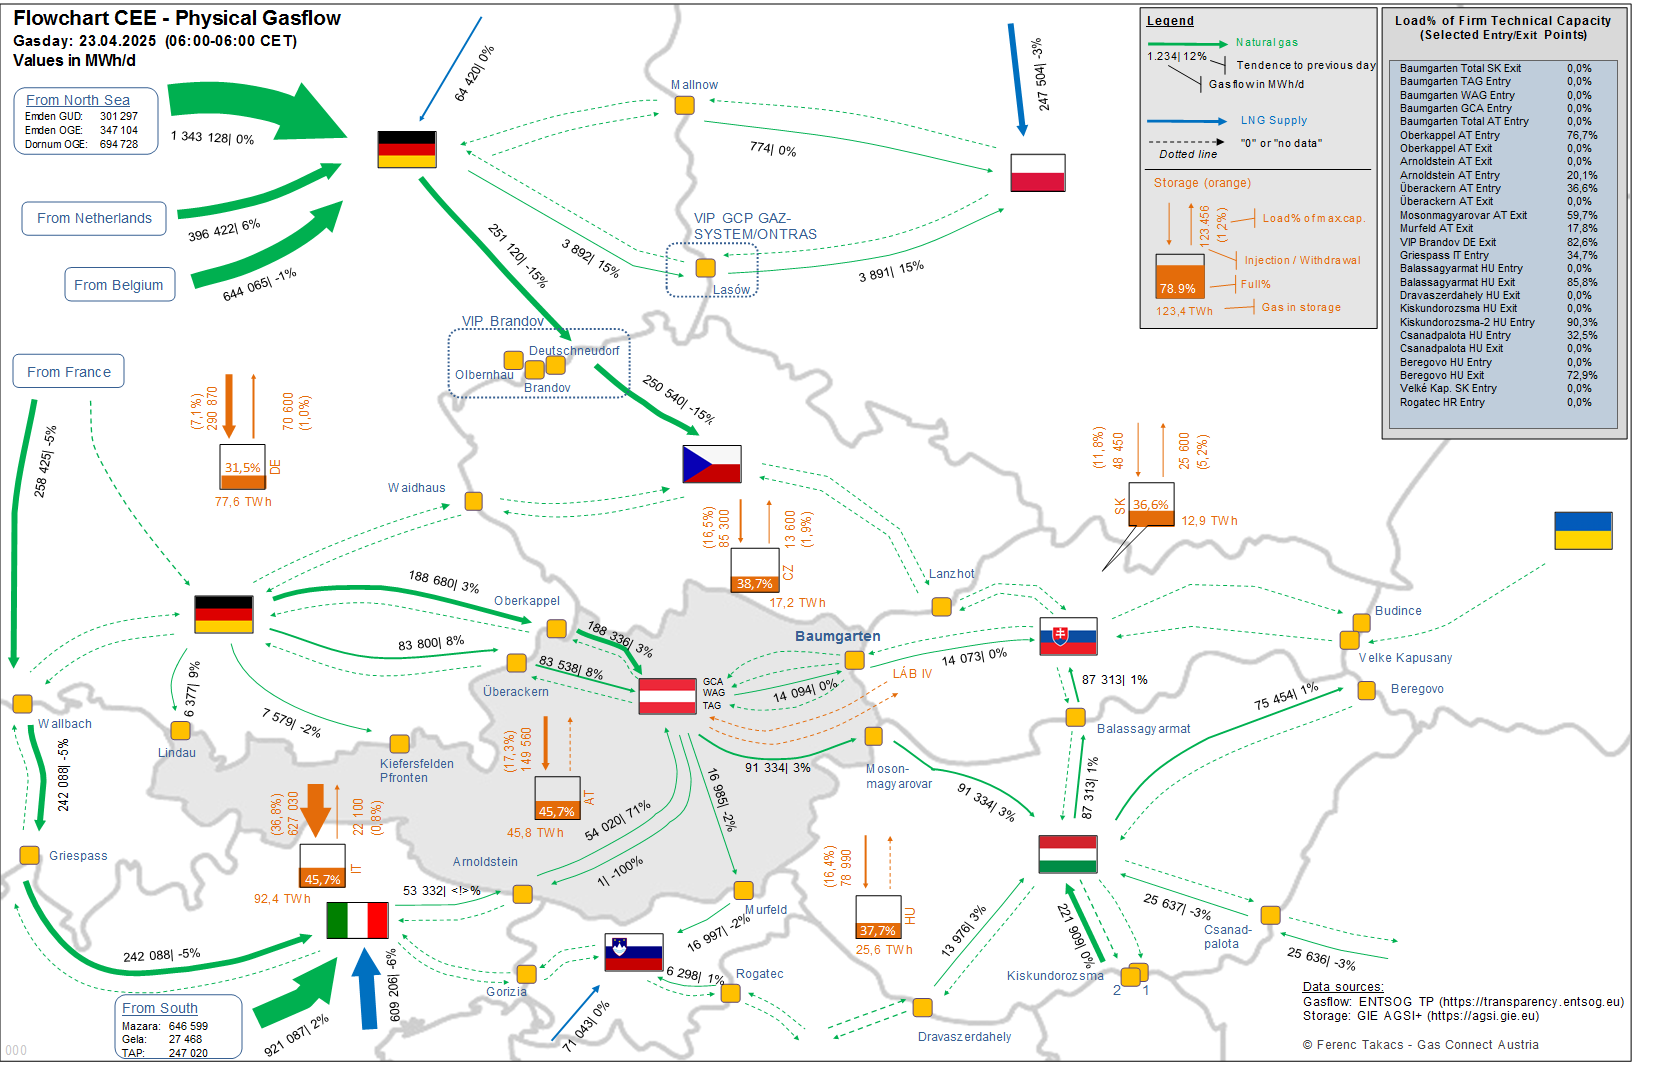
The visualization of daily physical gas flow and storage data in the CEE region and at selected entry/exit points gives you a complete overview without having to consult underlying tabular sources. In order to display storage and flow data together, the visible data status is usually that of two days ago.
Further sources of up-to-date information:
- On the website of the market area manager AGGM you can find the hourly updated market area data of the Austrian entry/exit points at https://platform.aggm.at/portal/visualisation/map.
- AGGM also publishes a daily status report: https://www.aggm.at/fileadmin//AGGM/Lagebericht/aggm-lagebericht.pdf.
- Updated information on domestic gas supply can also be found at e-control: https://www.e-control.at/ukraine-krieg-energieversorgung-in-oesterreich.
DISCLAIMER
The data that GCA visualises in this presentation come from publicly accessible sources, whereby the data entered on the platforms in question are made available for public use free of charge.
- The Transparency Platform of ENTSOG (https://transparency.entsog.eu/#/map)
- GIE AGSI+ platform (Link: https://agsi.gie.eu/#/)
GCA accesses these data and visualises them in the best possible way. The gas day shown in each case starts at 6:00 a.m. (CET). Since the storage data are only available with a delay of 24 hours and are visualised together with the gas flow data, the visualisation usually represents the status 2 days ago.
GCA does not make any assurances regarding the correctness or completeness of the visualised information. Any decisions and actions taken by the user on the basis of this information are the sole responsibility of the user. GCA assumes no liability in this regard.